In a given application, we have information about the ages of a
set of 12 people. Their values are 12, 30, 24, 10, 10, 23, 43, 67, 79, 34, 56, 51.
a)
What is the median of these ages? Explain.
b)
What is the mode of these ages? Explain.
c)
How would you obtain the difference between the 99%
percentile and the 10% of this set of ages, in R?
e o percentil 1% deste conjunto de idades.
d)
What are the results of normalizing and standardizing these
data?
Suppose that we add two more age values to the set mentione in
item (1): 10 months and 100 years.
a)
Apply normalization and standardization to this new set of data.
b)
Should you give any preference to apply normalization or
standardization to this new set of data?
Answer the following questions:
a)
What is the objective of boxplot graphs?
b)
What are the functions of the spread measures: ``range'' and
``interquartile range''. Is there any advantage of using one over
the other?
c)
What other spread measures can we use to analyse data?
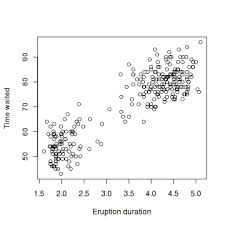
Figure 1 shows a ``scatterplot''. What information
can you infer from this graph?
Figure 1:
Scatterplot Example
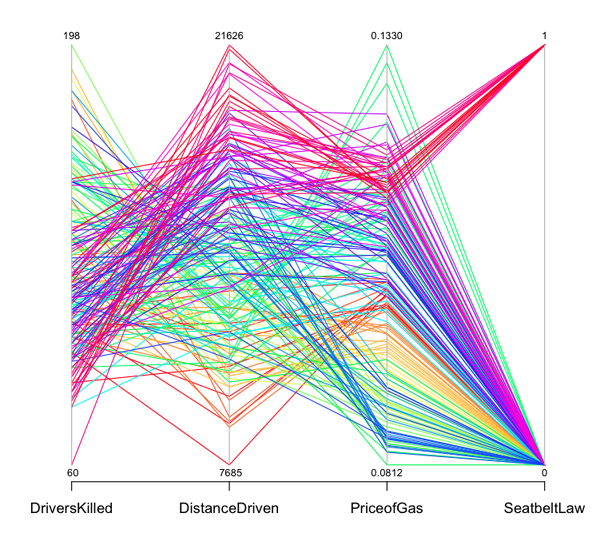
Figure 2 shows a ``parallel plot''. What kind of
information can you infer from this graph?
Figure 2:
Parallel plot Example
When visualizing data, it may be important to reorder/rearrange variables or
sort variable values. Give na example, where this order can yield a
better visualization than visualization of the original not
rearranged data.
The ``nearest neighbours'' strategy can also be used to ``impute''
values to unlnown variable values. Explain how you can use nearest
neighb ours to impute missing variable values.
What is the main idea behind PCA - Principal Component
Analsysis and why is it useful?
Give a brief description of the k-means clustering algorithm.
Suppose you are given a CSV (Comma-Separated Values) table. When
you read this table using the R function read.csv, what are
the variable types stored internally if a variable has only two
values? How about when you read the same data in the WEKA software?
What are the basic variable types used in data analysis?
Explain the difference between the distance calculated using
``simple matching'' and the ``Jaccard'' distance. In what situation,
we apply one or the other?
What is ``supervised'' machine learning?
What is ``cluster analysis'' used for?
What is the difference between Pearson correlation and simple
linear regression?
Consider the following data table:
Inst/Var
V1
V2
I1
1.5
1.7
I2
2
1.9
I3
1.6
1.8
I4
1.2
1.5
Given a new observation (1.4,1.6), which two observations in the
table are nearer the new data point, using the Euclidean distance?
What is the difference between hierarchical agglomerative
clustering and hierarchical divisive clustering?
Explain why using the ``Error rate'' to evaluate a
classification model may not be a good approach.
Which approach would you use to plot a histogram for a
continuous numeric variable.