"Real World Haskell", Bryan O'Sullivan, John Goerzen & Don Stewart. Chapter 25.
Haskell performance tutorial @ CUFP, Johan Tibell:
http://blog.johantibell.com/2010/07/high-performance-haskell-tutorial-at.html
avg :: [Double] -> Double
avg xs = sum / fromIntegral (length xs)
 -- sum :: [Double] -> Double
 -- length :: [Double] -> Int

main = do
   n <- read <$> getLine
   print (avg [1..n])
How much memory does this program use for input \(n\)?
$ stack build
$ stack exec example -- +RTS -s -RTS-- marks the end of stack options+RTS and -RTS are options for the GHC runtime system (can ommit the closing -RTS)-s prints a summary of runtime statistics$ echo 1e7 | stack exec example -- +RTS -s +RTS
1,680,163,544 bytes allocated in the heap
1,202,239,544 bytes copied during GC
335,815,968 bytes maximum residency (13 sample(s))
68,227,472 bytes maximum slop
762 MB total memory in use (0 MB lost due to fragmentation)
Tot time (elapsed) Avg pause Max pause
Gen 0 3198 colls, 0 par 0.280s 0.303s 0.0001s 0.0003s
Gen 1 13 colls, 0 par 0.608s 0.773s 0.0595s 0.3081s
INIT time 0.000s ( 0.000s elapsed)
MUT time 0.548s ( 0.533s elapsed)
GC time 0.888s ( 1.076s elapsed)
EXIT time 0.008s ( 0.030s elapsed)
Total time 1.552s ( 1.639s elapsed)
%GC time 57.2% (65.7% elapsed)
Alloc rate 3,065,991,868 bytes per MUT second
Productivity 42.8% of total user, 34.3% of total elapsed762 MB total memory in use
%GC time 57.2% (65.7% elapsed)Why did this program use so much memory?
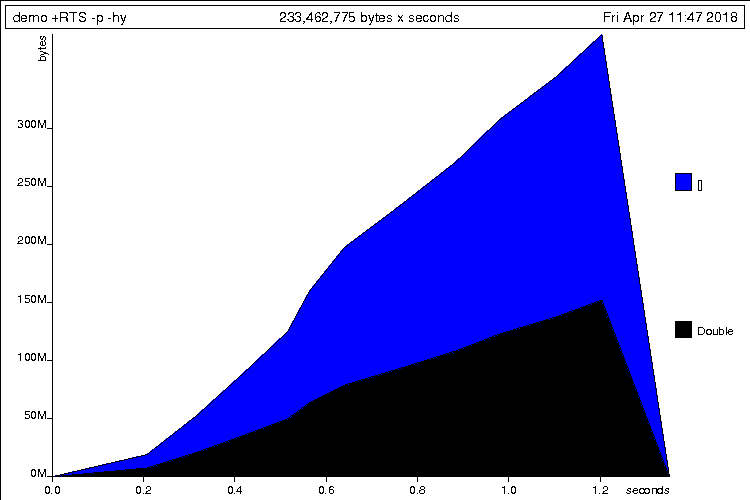
$ stack build --executable-profiling
$ echo 1e7 | stack exec example -- +RTS -p -hc
# generates `example.prof':
Fri Apr 27 11:38 2018 Time and Allocation Profiling Report (Final)
example +RTS -p -hc -RTS
total time = 1.17 secs (1171 ticks @ 1000 us, 1 processor)
total alloc = 1,680,126,272 bytes (excludes profiling overheads)
COST CENTRE MODULE SRC %time %alloc
main Main src/Main.hs:(10,1)-(12,20) 88.1 100.0
avg Main src/Main.hs:7:1-42 11.9 0.0
...Profiling again to this time to collect heap allocation by data types.
$ stack build --executable-profiling
$ echo 1e7 | stack exec example -- +RTS -p -hy
# generates `example.prof' and `example.hp'
$ hp2ps -c -e5in example.hp
# generates `example.ps' chartavg :: [Double] -> Double
avg xs = sum xs / fromIntegral (length xs)
main = print (avg [1..1e7])main (the list of 10 million Doubles)avg retain the entire list rather than consume it one value at a time?avg :: [Double] -> Double
avg xs = worker xs (0,0)
where
worker :: [Double] -> (Double,Int) -> Double
worker [] (s,n) = s / fromIntegral n
worker (x:xs) (s,n) = worker xs (x+s,1+n)Compiled with optimizations (-O2) the program uses constant space.
Compiled without optimizations (-O0) we get worse results than before!
Why this difference?
cond :: Bool -> a -> a -> a
cond True x y  = x
cond False x y = y

bottom :: Int -> Int
bottom x = bottom x

> bottom 0
 --- infinite loop, Ctrl-C
> cond True 42 (bottom 0)
42+, -, *, etc.)case, if, pattern matching avg [1,2,3]
= worker [1,2,3] (0,0)
= worker [2,3] (1+0,1+0)
= worker [3] (2+1+0,1+1+0)
= worker [] (3+2+1+0,1+1+1+0)
= (3+2+1+0) / fromInt (1+1+1+0)
= 6 / 3
= 2.0 avg [1,2,3]
= worker [1,2,3] (0,0)
= worker [2,3] (1+0, 1+0)
= worker [2,3] (1, 1)
= worker [3] (2+1,1+1)
= worker [3] (3, 2)
= worker [] (3+3,1+2)
= worker [] (6, 3)
= 6 / 3
= 2.0seq or the BangPatterns extensionThe primitive function seq function allows controlling evaluation order.
seq :: a -> b -> bEvaluation of seq x y first evaluates x and then returns y.
Using seq to force evaluation of both s and n before the tail recursive call.
avg :: [Double] -> Double
avg xs = worker xs (0,0)
  where
   worker :: [Double] -> (Double,Int) -> Double
   worker [] (s,n) = s / fromIntegral n
   worker (x:xs) (s,n)
= s `seq` n `seq` worker xs (x+s,1+n)Bang patterns (!) also allow forcing evaluation.
{-# LANGUAGE BangPatterns #-}

avg :: [Double] -> Double
avg xs = worker xs (0,0)
  where
   worker :: [Double] -> (Double,Int) -> Double
   worker [] (s,n)       = s / fromIntegral n
   worker (x:xs) (!s,!n) = worker xs (x+s,1+n)
-- ^^^^^^^ "bang" patternsRecall the higher-order fold operations (also called reduce) that process a list using some argument function.
https://en.wikipedia.org/wiki/Fold_(higher-order_function)
foldr (+) 0 [1, 2, 3, 4, 5]
= 1 + (2 + (3 + (4 + (5 + 0))))

foldl (+) 0 [1, 2, 3, 4, 5]
= ((((0 + 1) + 2) + 3) + 4) + 5foldr requires traversing the entire before we can start accumulatingfoldl can start accumulating immediatelyWe could rewrite the average example using a left fold.
avg :: [Double] -> Double
avg xs = s / fromIntegral (n :: Int)
   where (s, n) = foldl f (0,0) xs
         f (!s,!n) x = (x+s,1+n)
However, even with bang patterns, this still exhibits excessive space use!
foldlfoldl f z [] = z
foldl f z (x:xs) = f (fold f z xs) x
foldl f z [x1, x2, x3, x4]
=
f (f (f (f z x4) x3) x2) x1For a list with \(n\) elements builds up a thunk f (f (...)) of \(n\) applications of the function \(f\).
To avoid building up the large thunk we should to use foldl' (from Data.List):
foldl' f z [] = z
foldl' f z (x:xs) = let z' = f z x
                    in z' `seq` foldl' f z' xs
foldl' forces evaluation of f before each recursive call.
import Data.List (foldl')

avg :: [Double] -> Double
avg xs = s / fromIntegral (n :: Int)
   where (s, n) = foldl' f (0,0) xs
         f (!s,!n) x = (x+s,1+n)
Note the we also need the bang patterns (!).
Knowning how GHC represents values in memory is useful
GHC represent the list [1,2] = 1 : (2 : []) as
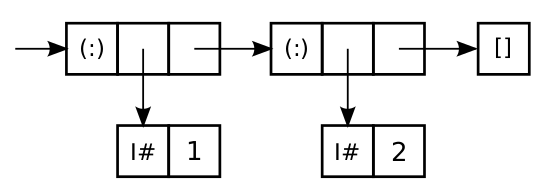
   data T a b = C1 a | C2 a b
-- C1 takes 2 words; C2 takes 3 wordsNothing, True or []) take zero space because they are shared among all uses.#
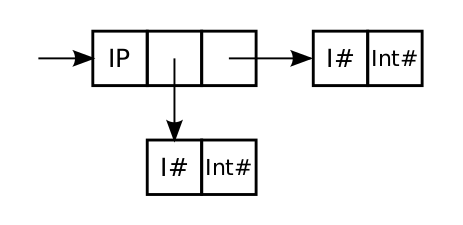
Int#, Double# data Int = I# Int#Int are called boxed (they are stored as small "boxes" in the heap)data IntPair = IP Int IntHow many words are used to store a value of this type?
Answer: 7 words.
Because of lazy evaluation e.g. Int values may be thunks.
cond :: Bool -> Int -> Int -> Int
cond True x y  = x
cond False x y = y

> cond True 42 (1`div`0)
42GHC allows controls over data representation using the UNPACK pragma:
Add the pragma just before the strictness annotation (!):
data Foo = Foo {-# UNPACK #-} !IntGHC will also unpack automatically if you compile with optimizations.
data IntPair = IP Int Int
data IntPair = IP {-# UNPACK #-} !Int
                  {-# UNPACK #-} !Int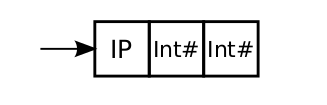
However: there are situations where making fields strict and unpacking them can hurt performance e.g. the data is passed to a non-strict function.