The development of efficient parallel logic programming systems is not an easy task. These systems need to tackle some hard problems such as parallel debugging and dynamic distribution of varied sized work among processors. Some applications have very low degree of parallelism, either and-parallelism or or-parallelism or have very small input data size. Usually programs that present very low degree of parallelism use sequential programming style, what makes them difficult to parallelise transparently.
Programs that present a reasonable amount of parallelism can lead to good performance on parallel systems. However, in practice, there are several issues that contribute to bad performance of the parallel systems even when the application has sufficient parallel tasks to supply the number of processors available. In most parallel logic programming systems these problems are directly related to workload distribution strategies since task switching is not a constant time operation [53]. In order to achieve good performance and scalability, parallel systems need to be optimised to the target parallel machine used.
Added to the difficulties posed above, parallel systems developers face the problem of debugging on a parallel environment where the response time is totally non-deterministic due to the interference of operating system operations.
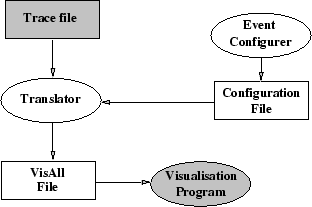
One interesting way of dealing with the problems mentioned before is to provide the user with a visualisation tool that can mirror the parallel execution of the logic program. This work gives a major contribution in this direction with the design and implementation of a flexible visualisation tool for parallel logic programming systems, the VisAll system.
VisAll is a flexible and universal tool, whose main goal is to develop a parallel logic programming system that integrates exploitation of all kinds of parallelism in logic programming. The main goals of VisAll are (1) to allow developers to identify points of the parallel implementation that need to be optimised for the target parallel architecture used, and (2) to help in parallel debugging. Initially, the system was designed to help the development of SBA [31], a parallel logic programming system that exploits both or-parallelism and independent and-parallelism. Currently, VisAll is capable of visualising synthetic tracefiles of the target SBA system and other tracefiles taken from other parallel systems such as Muse, Aurora and &Prolog. The system is flexible because users can specify graphical objects and trace events to be visualised. By universal we mean that VisAll is capable of visualising any kind of major form of parallelism that is exploited in parallel logic programming systems.
Other visualisation tools have been developed to parallel logic programming systems, such as WAMtrace [41], VisAndOr [51], ViMust [96] and VACE [106]. Each one of these systems work for a different parallel logic programming system. VisAll is the first attempt at unifying the visualisation paradigms exhibited by the other visualisation tools adding extra more features important to system optimisation and debugging.
The algorithms used by VisAll do not pose any limit to the size of the tracefiles. The only memory restriction is the computer's.
Figure 4 shows a scheme of the system, with its components and their relationship.
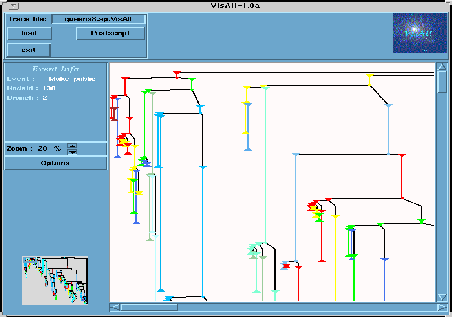
Figure 5 shows a visualization program example exhibiting all VisAll features.
The visualisation program is implemented on top of Tcl/TK. Currently, it displays the dependency graph contained in a VisAll file, shows some information associated to each event, a legend with information about each icon, and individual execution time for each processor.
The whole graph is reduced and showed in the small picture on the left. The small picture also has a small box indicating the part that is being visualised in the larger image. The image on the right shows the graph at different sizes controlled via a zoom button. When the graph does not fit in the window, scrollbars are used to navigate through the graph. On the left hand side top corner of the graph, VisAll shows information about each event (node). It is enough to click on any node to obtain the information that corresponds to that event.
VisAll also allows the user to associate the processor execution time with the branch of the tree where the worker is positioned. It is enough to click on the worker bar in order to obtain the position where the worker is in the tree.