 (1)
(1)The rules constructed by the individual systems are characterized on the basis of tests. The tests require some data, however. Here we have used all the data the individual systems had available (D1 .. Dn). In general, however, the test data may consist of any other representative sample of data. The results of tests are both qualitative and quantitative. The objective of qualitative characterisation is to provide detailed information about relative benefits of individual rules (or theories) to the integration system. This information takes the form of lists of cases covered by a particular rule (or theory). The objective of quantitative characterization is to estimate the overall accuracy of the individual rule (or theory).
Qualitative characterisation of a particular rule consists of two lists. The first one consists of all the test cases that were correctly covered by this rule. In other words this list refers to the positive examples covered the rule.
The second list consists of all the cases that were incorrectly covered by the rule. This list represents the negative examples covered by the rule in question. The lists mentioned do not need to contain complete descriptions of each case. For our purposes it is sufficient to store only case identifiers (indeces) that uniquely identify each case.
Qualitative characterisation of theories can be done in a similar manner. The lists will consist of cases correctly (or incorrectly) covered by a given set of rules (theory).
Quantitative characterization of rules is done using estimates of accuracy. These are calculated on the basis of tests. The tests are done in a usual manner by comparing the classification predicted by rule R with the correct classification that is given. This comparison enables us to decide whether the particular rule classified the case correctly. The classification errors caused by misclassification are sometimes referred to as errors of commission. Errors of omission arise whenever an expert or a system fails to classify some case, that is, when no classification is actually predicted.
Here we will use the notion of rule quality which depends on estimates of accuracy. In the following we shall describe one particular method of determining rule quality which has proved rather sucessful in practice.
In our system rule quality is calculated using the expression:
 (1)
(1)
where
ACR represents an estimate of accuracy of rule
R
and EST_COVC,R an estimate of coverage.
The estimate of accuracy of rule R is calculated using the following formula:
 (2)
(2)
where
CR represents the number of correctly classified
cases
and ERR the number of misclassifications.
As we can see ACR represents a ratio of correctly classified cases to all relevant cases. The errors of errors of omission (ENR) are not included in this expression. These play a role in EST_COVC,R discussed below.
The expression EST_COVC,R represents a function whose value depends on coverage. When used, it forces the system to opt for rules with relatively high coverage of the corresponding class. The value lies between 1/e and 1. It is calculated as follows:
 (3)
(3)
where
 (4)
(4)
The antecedent of rule R determines with which class the rule is concerned (say C). Then NC represents the total number of examples of this class. The expression CR /NC represents a ratio of correct classifications to the total number of examples of the class. The expression captures the notion of relative coverage of class C by rule R. From (1) and (3) we obtain the following formulation:
 (5)
(5)
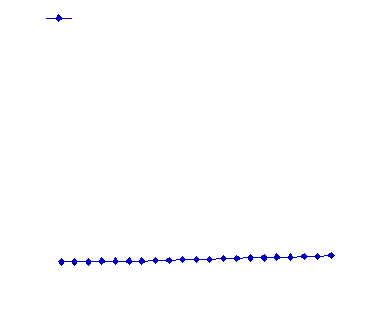
The following figure illustrates the dependance of QR on relative coverage (CR/NC) for different values of ACR.

rule(1-5, metastase <- earlyuptakein = no defectinnode = lac_central, 15, 3).
for example, represents rule 1-5 (rule 5 of theory T1). The numbers 15 and 3 represent number of correctly classified cases (C1-5) and number of misclassifications (ER1-5). The accuracy of this rule is thus
AC1-5 = C1-5 / ( C1-5 + ER1-5 ) = 15 / (15 + 3) = 0.833
Supposing we had 30 examples of metastase (Nmetastase = 30) then Q1-5 would be:
Q1-5 = 0.83 * e(15/30 - 1) = 0.833 * 0.61 = 0.506
Both qualitative and quantitative characterizations of theories are used in the construction of the integrated theory.
Later on we shall discuss other possible methods of estimating rule quality. The method described in this section will be referred to as the method based on rule accuracy and relative coverage, or as the method was devised by Luis Torgo, simply as the method of Torgo.