The purpose of our experiments was to compare the performance of the integrated theory with the performance of the original theories.
The tests were performed on lymphography data obtained from JSI, Ljubljana. This data contains 148 cases which are characterized by 18 attributes and there are 4 possible classes.
Each theory was generated by an inductive system (IRule1 or ITree1) on the basis of a given number of examples which were selected from a given pool by a random process. The numbers of training examples used were 5, 10 .. 50. In order to exclude the possibility of fortuitous results the experiments related to N training examples were repeated 20 times.
The perfomance of system S1, obtained on the basis of, say, 15 training examples was assessed by calculating the mean performance of 20 similar theories generated by this system. The mean performance in this case was 57.0 %. The results of our experiments are shown in Table 1. The performance figures are shown in Table 1a. Standard deviations related to these measurements appear in Table 1b. Table 1c shows how many rules are contained in each theory.
Table 1. Comparisons of the Integrated Theory TI and the Individual Systems (S1-S4).
5 10 15 20 25 30 35 40 45 50 examples
S1 38.8 47.2 57.0 54.1 52.0 58.1 56.4 57.3 60.5 64.6 %
S2 39.0 52.6 49.9 54.0 57.4 55.8 58.2 58.6 63.4 63.6
S3 42.3 51.0 55.3 60.5 61.4 66.4 63.5 64.6 68.6 70.9
S4 45.5 56.3 60.5 60.6 64.3 62.0 64.4 64.7 68.6 66.6
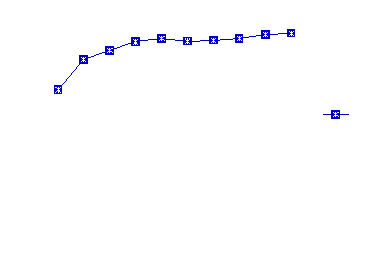
TI 55.1 66.5 70.0 73.1 74.2 73.4 73.8 74.4 75.9 76.5 %
Gain 13.7 14.7 14.3 15.8 15.4 12.9 13.2 13.1 10.6 10.0
Table 1a. Performance.The first four rows of the table show the performance figures of individual systems (S1-S4). Systems S1,S2 use IRule1 inductive learning method while systems S3,S4 use method ITree1. All the figures shown are means obtained on the basis of 20 independent experiments. The last row shows the gain calculated as a difference between TI and the mean (S1+S2+S3+S4) / 4. As can be seen the performance gains were around 15%.
5 10 15 20 25 30 35 40 45 50 examples
S1 14.6 8.8 7.7 9.0 7.7 9.7 10.7 6.9 6.5 9.6 %
S2 16.1 12.7 13.0 9.2 9.9 7.2 8.1 9.3 9.0 11.0
S3 17.9 15.3 12.7 10.6 11.3 8.1 9.2 9.7 6.0 7.0
S4 23.0 14.0 14.3 11.5 11.1 10.0 7.6 7.4 9.9 10.1
TI 9.4 8.9 8.6 5.4 6.6 8.0 6.8 6.7 7.4 6.6 %
Table 1b. Standard Deviations of Performance
5 10 15 20 25 30 35 40 45 50 examples
S1 4 5 6 8 9 11 12 13 13 15 rules
S2 3 5 6 8 9 10 11 12 15 15
S3 3 5 7 9 10 12 15 16 17 19
S4 3 5 7 9 10 13 13 16 17 19
TI 5 7 10 12 14 16 17 19 20 20
%
Table 1c. Sizes of Theories (Numbers of Rules). The first four rows of the table show the size (number of rules) of theories generated by the individual systems (S1-S4). All the figures shown represent rounded means obtained on the basis of 20 independent experiments. As we can see the size of the integrated theory exceeds somewhat the size of each individual theory, but it contains less rules than the total of rules generated by S1-S4.
Figure 3 shows some of the performance results in a graphical form. The performance of the integrated theory TI exceeds the performance of the individual systems by about 15%. The integrated theory is also quite "stable", in the sense that its performance does not fluctuate as much as the performance of the individual systems (see Table 1b). Although the size of the integrated theory exceeds the size of each individual theory, the total number of rules is relatively small (see Table 1c)[3].

A question arises whether the performance gains could, perhaps, be attributed to a suboptimal performance of systems S1-S4. In order to discount this possibility we have decided to check whether the individual systems have a satisfactory performance, when compared to other systems reported in literature. We have chosen two systems (S1, S3) and these were were supplied all the data available for training. These experiments were repeated 20 times. The results are shown in the following table.
Table 2. Highest Mean Performance of Different Systems
System Method Performance St. Deviation No. of Rules
S1 IRule1 70.1 7.1 25
S3 ITree1 73.5 6.0 34
TI INTEG3.1 76.5 6.6 20
The results shown in Table 2 indicate that the systems IRule1 and ITree1 attain satisfactory results in this domain. Other systems for this domain which were reported in literature tend to be in the region of 70-80%. The performance of the integrated theory TI was extracted from Table 1 and included here for comparisons.